The 'ABC' of High School Success
An interactive data story on high school success indicators
Visit Live SiteOverview
This data story provides information for parents, community members, and educators from the Massachusetts Department of Elementary and Secondary Education (DESE) on how attendance, behavior, and course performance in Massachusetts high schools affects post-secondary outcomes. DESE has data programs to collect and analyze student and school data, but not all of them are easily consumable by the public. By exploring data on attendance, behavior, and course performance — the ABCs — this data story provides insights into a student's chances to graduate on time, go to college, or even stay in college. Parents and educators can use this information to set students up for success or help them get back on track if they're behind.
My Roles
I worked closely with the Department of Education and Secondary Education on developing this interactive data story to highlight the impact of the ABCs by following a group of students from the time they entered 9th grade, to when each left or completed high school. With the cohort datasets provided by the department, I was able to create storyboard, design the data visualization and interactive content, create prototypes. The site was built using React with accessibility in mind.
Prototype, Test and Iterate
Correlation between failed courses and graduation rate explorations
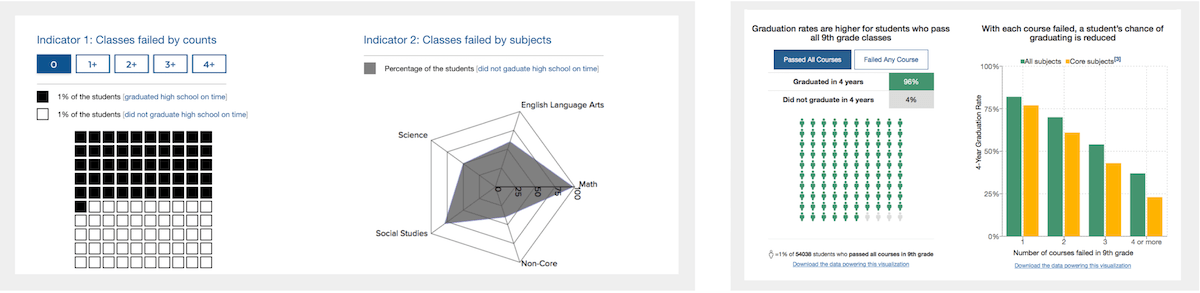
Radar Charts or polar chart are a way of comparing multiple quantitative variables, useful for seeing which variables are scoring high or low within a dataset, making them ideal for displaying multi-dimensional datasets. However, the graduation data were collected by subjects and didn't have the granularity of the number of failed courses, so we couldn't join the pass/fail data with graduation data. We ended up combining the subject data into two categories — all subjects vs. core subjects to eliminate the compounding factors that could lead to biased conclusions.
11th grade data visualization explorations
hn
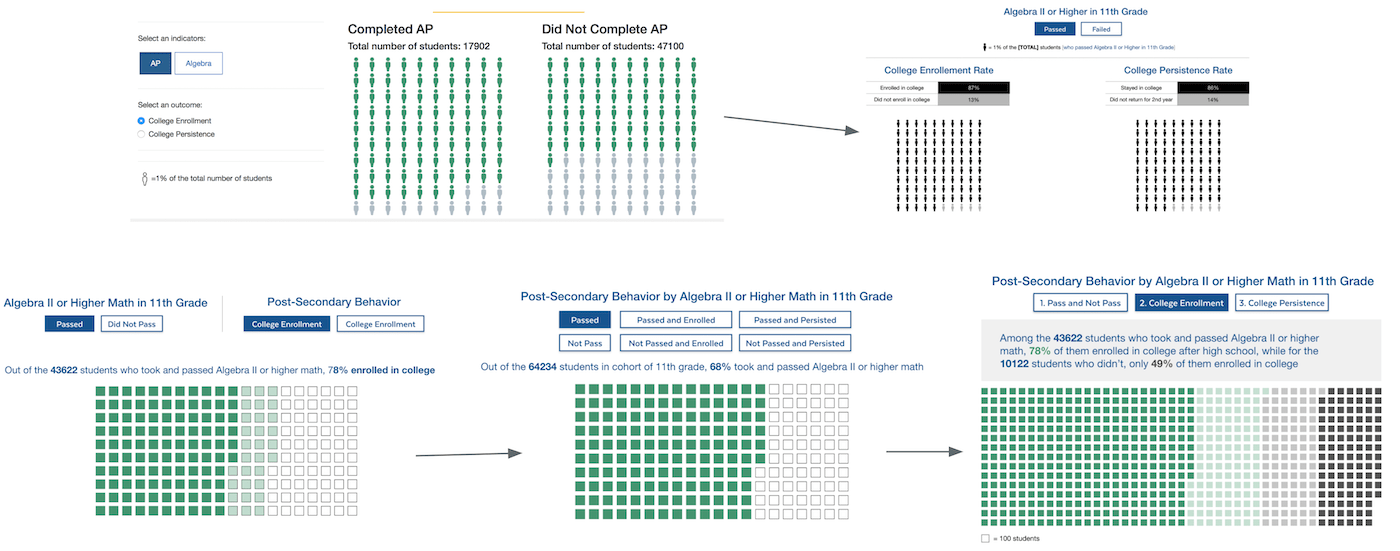
Narrative makes complicated data simple. As we iterate based on user testing and feedback, we moved towards a more curated approach for illustrating the cohort datasets. Embedding interactive data visualization with contextual text explanationslet allowed viewers to be more engaged in the narrative.